
AI Share of Voice: How to Measure and Interpret It
 Evgeniya Zemlyanskaya16 min readSeptember 15, 2026
TL;DR
AI Share of Voice describes your brand's share of measured presence relative to competitors in a sample of AI answers. Methods may count mentions or citations, or weight appearances by position or estimated demand. Each approach captures a different aspect of visibility. Findrix uses mention share to track competitive presence and keeps citations, position and preference separate. SoV shows whether your brand gains or loses ground within the measured set; the underlying answers help identify where to act.
Findrix is an action-based AI visibility and GEO platform that turns ongoing tracking and analysis of a brand's presence across AI answers and search into fast optimization, built for brand managers, marketing leaders, and agencies running AI search for their clients.
AI Share of Voice helps answer a competitive question: how much of the presence in AI-generated answers belongs to your brand? The challenge starts when you try to measure it: tools do not all use the same definition or calculation.
These differences make the result harder to interpret. Before you can explain why your share grew or fell, you need to know which version of SoV you are looking at. This guide examines the main approaches, explains why Findrix uses mention share and shows how to use the metric to choose your next action.
What is AI Share of Voice?
AI Share of Voice measures a brand's share of a defined signal, such as mentions, relative to selected competitors in a sample of AI-generated answers.
Why AI Share of Voice matters
A buyer comparing solutions can discover an alternative before visiting any vendor's website. Questions about a problem, a required feature or a shortlist give AI systems an opportunity to introduce brands. For an SEO or marketing team, measuring presence in those answers makes a part of product discovery visible that website traffic alone cannot describe.
In this illustrative example, your mentions rise from 20 to 30 under the same measurement setup. Competitors' mentions rise faster, from 80 to 170, so your share falls from 20% to 15%.
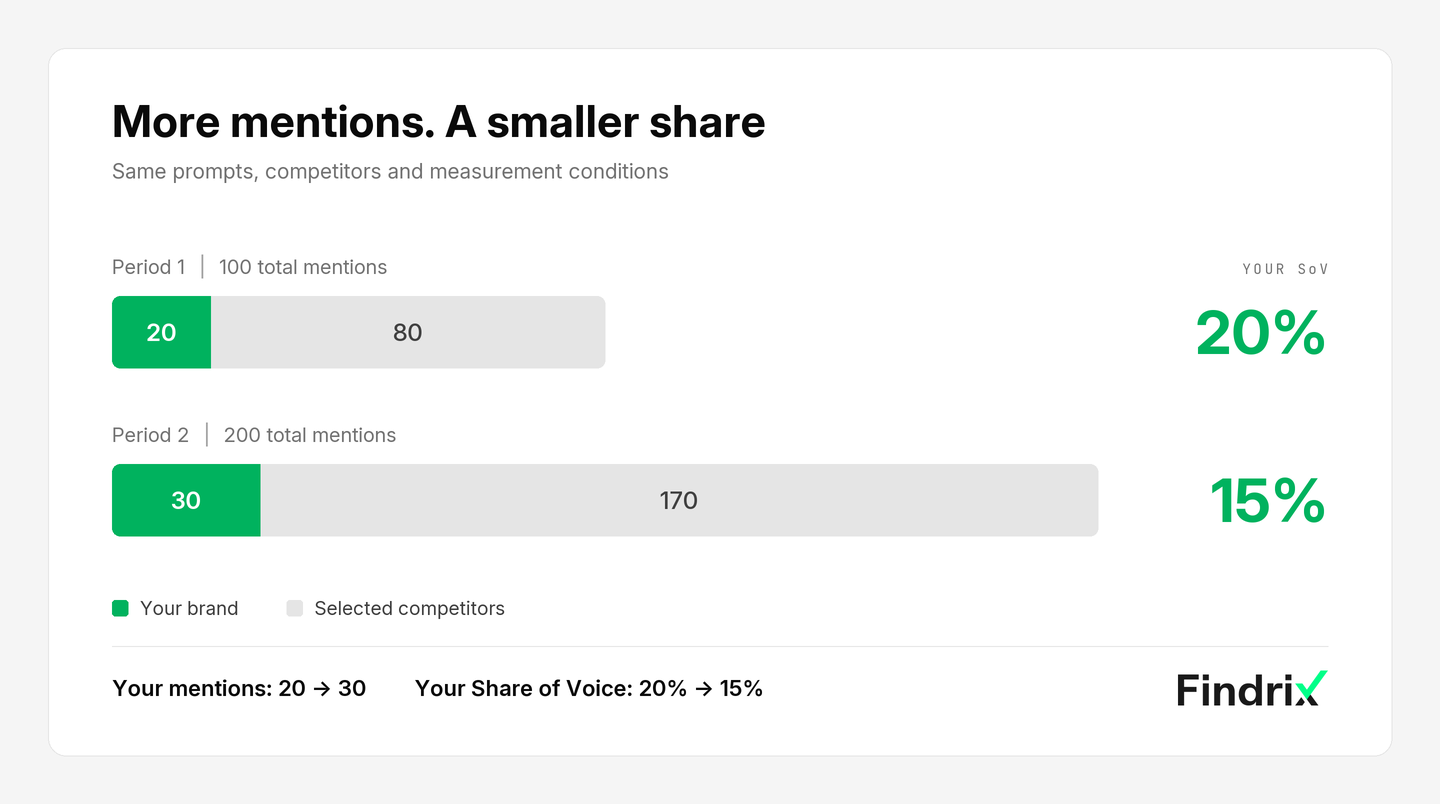
More mentions can still mean a smaller competitive share. Illustrative counts; the measurement setup is unchanged.
The competitive view also helps you prioritize. If your brand appears consistently for general category questions but is missing from answers about a capability customers buy you for, that gap deserves closer attention. Read which alternatives appear and what the engine says about them. Then check whether your own pages explain the relevant capability clearly enough. This gives a small SEO team a reason to work on a particular page instead of assigning a broad content refresh.
Repeated measurements make that work reviewable. Keep the questions and competitive set consistent, record what your team changed, and return to the affected answers. You can then report whether the brand appeared more often, whether the competitive gap narrowed and whether the description became more accurate.
For Findrix, the value of SoV is this connection between competitive context and a decision. The percentage helps locate the gap; the answers and pages help determine the work. Sales, conversions and customer-reported discovery remain separate evidence of business impact.
How to calculate AI Share of Voice
There is no single formula used by every AI visibility tool. Different methods count different signals or assign different weights, which adds complexity when comparing results. Four common approaches are:
- Mention-based SoV: your brand's mentions as a share of mentions across the tracked brands.
- Citation-based SoV: citations to your domain as a share of citations to the selected domains.
- Position-weighted SoV: your brand's weighted appearances as a share of all tracked brands' weighted appearances, with more weight given to prominent positions.
- Volume-weighted SoV: your brand's estimated impressions as a share of estimated impressions across tracked brands, using a demand proxy such as search volume.
These methods answer different questions. The calculation below uses mentions; the following subsections explain how the other approaches change the result.
For mention-based SoV, the formula is:
AI Share of Voice = your brand's mentions ÷ total mentions of your brand and selected competitors × 100
For example, your brand receives 20 mentions and your selected competitors receive 80 across the monitored answers. Your SoV is 20 ÷ (20 + 80) × 100 = 20%. These are illustrative counts, not Findrix customer results.
The denominator includes your brand. It is not the number of prompts or the number of people who saw an answer.
The result depends on the prompts, competitors, AI engines, markets and time period included in the measurement. It also depends on what the methodology treats as "voice." That is why a Share of Voice score should never be separated from its measurement setup.
Why AI Share of Voice formulas differ
Published definitions illustrate the difference. Peec defines SoV as the share of mentions among tracked brands. Ahrefs defines it as the share of estimated impressions among tracked brands, with impressions weighted using Google search volume. A 20% score under one definition is not equivalent to 20% under the other.
Mention-based Share of Voice
Mention-based SoV divides the number of brand mentions by the mentions received by all brands in the defined competitive set.
This answers a specific question: what share of the counted brand mentions belongs to us? Findrix uses this definition to keep competitive presence separate from citation, position and preference metrics.
Findrix counts each brand at most once per answer. Repeating the same brand name several times adds no extra mentions; the same rule applies to the tracked competitors. This keeps repetition within a long response from inflating its contribution to SoV. Mentioning a brand and recommending it are measured separately.
Citation-based Share of Voice
Citation-based SoV compares citations to a brand's domain with citations to the domains in its competitive set.
This shows which domains receive the measured citations. Read the cited page alongside the answer to understand what information the engine used. But citation share and brand presence are not interchangeable. An AI answer may mention or recommend a company without linking to its website. It may also cite a company's content without presenting the company as a recommended solution.
Position-weighted Share of Voice
A position-weighted methodology assigns weights according to where a brand appears in the answer. A first-position mention may receive more weight than one near the end. Recommendation strength and the amount of discussion are separate signals; including them requires additional scoring rules.
Without published weights, you cannot tell how much each position contributes or reproduce the score. A higher percentage may look like progress while leaving you unable to explain what improved. Even disclosed weights need interpretation: giving first position twice the weight of second does not establish twice the value to a buyer.
At Findrix, we believe an opaque measurement can be more harmful than having no measurement: it gives a decision the appearance of evidence without a way to check the reasoning. It can send a team toward the wrong fix or make an unjustified budget decision look defensible. That is why we keep position separate from mention-based SoV.
Volume-weighted Share of Voice
A volume-weighted model gives more weight to topics with higher estimated demand. Ahrefs, for example, uses Google search volume as a proxy in its impressions metric. That adds information about search interest, but it is not a count of people who saw the AI answer.
Findrix's methodology focuses on coverage of relevant questions rather than weighting SoV by assumed AI prompt frequency. A narrow question can still describe an important buying decision. Its business priority should be assessed from customer and sales evidence, separately from the mention-share calculation.
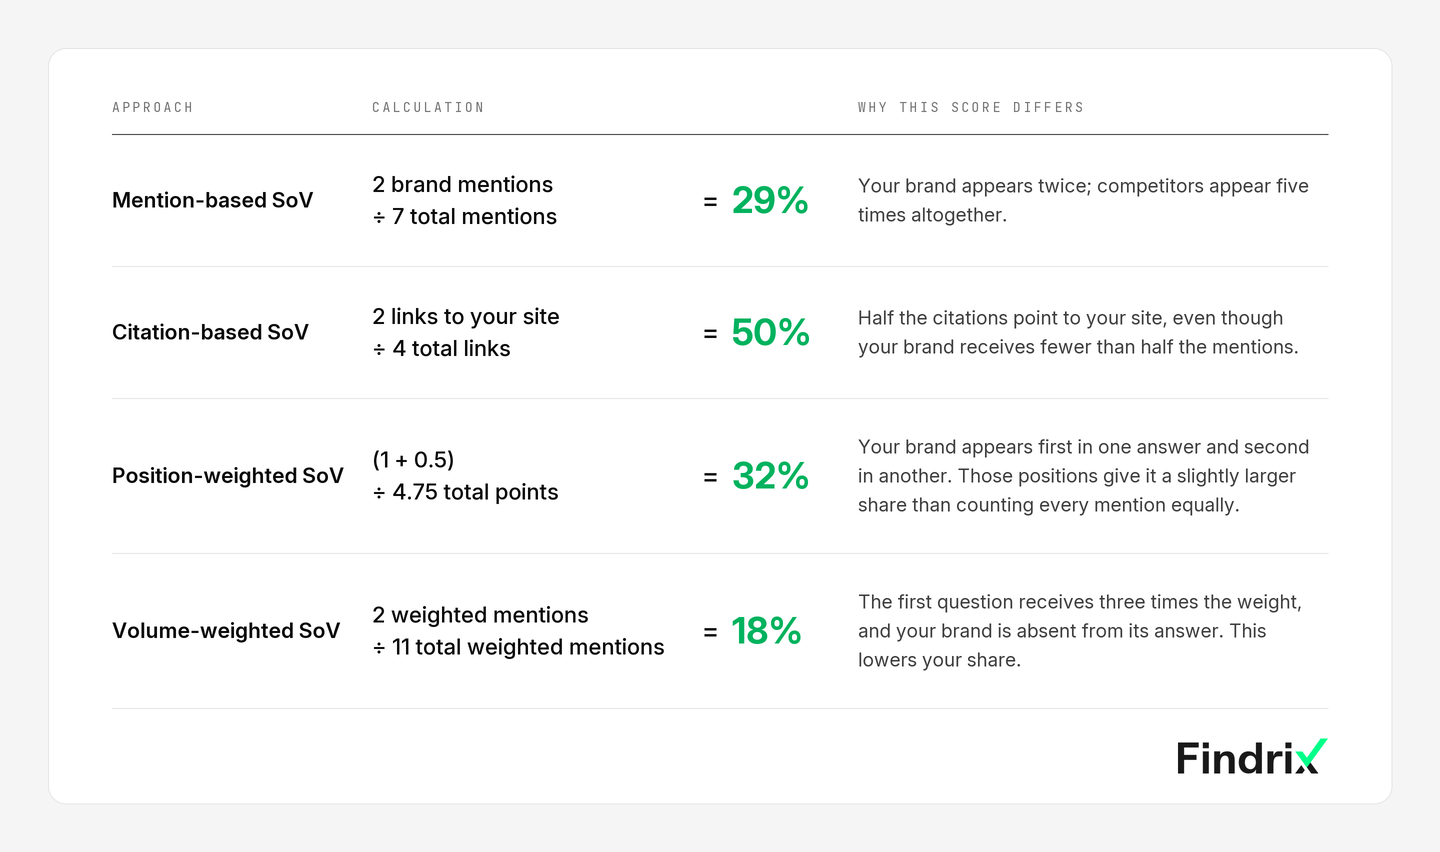
Illustrative example. Position weights: first = 1, second = 0.5, third = 0.25. Question weights: 3, 1 and 1. These weights demonstrate the calculation; they are not a specific tool's published methodology or measured audience impressions.
Related measures: presence and composite scores
These two measures are useful alongside the four approaches above. One measures how often a brand appears; the other combines several signals into an overall score.
Response-based presence: frequency of appearance
Another approach calculates the percentage of evaluated responses that contain the brand.
This is useful when the question is: how consistently do we appear? However, if the formula does not contain a competitive denominator, it behaves more like Visibility or Mention Rate than Share of Voice. Calling both measurements "SoV" can create confusion even when both calculations are internally consistent.
Composite scores: combining signals
A composite score combines several signals, such as mentions, citations, position and estimated impressions. It is an aggregate measure of visibility whose meaning depends on the components and their weights.
Composite scores compress several measures into one number. Without disclosed weights and component scores, an increase is hard to explain: it could come from more mentions, a higher position or a change in the scoring system.
A complex formula is not automatically better than a simple one. A good methodology is the one that matches the decision being made and remains transparent enough to interpret.
AI Share of Voice vs visibility vs citations
These metrics are related, but they answer different questions.
- Visibility or Mention Rate asks: how often does our brand appear in the evaluated answers?
- Share of Voice asks: how much of the measured competitive conversation does our brand occupy?
- Citation Rate asks what proportion of evaluated answers link to our site. Citation Share asks what proportion of the citations in a defined source set belong to us. Check the denominator before comparing them.
- Position asks where the brand appears when several brands are named. Preference asks which option the answer favors. A first mention is not necessarily an endorsement.
A brand can become more visible and still lose Share of Voice if its competitors grow faster. It can earn more citations without receiving more brand recommendations. And it can be mentioned frequently while rarely appearing as the preferred option.
Findrix keeps these signals separate because they lead to different investigations. A low mention share calls for checking where competitors appear. Frequent mentions with unfavorable descriptions call for inspecting what the answers say. Citations without a brand recommendation tell a different story again.
How Findrix measures AI Share of Voice and why
Findrix defines SoV as your mentions relative to the mentions of your brand and your named competitors in answers to non-branded prompts, measured per engine. Branded prompts are excluded. We keep citations, position and preference separate so each metric answers a clear question.
The basic formula is only the start. A useful measurement also depends on which questions enter the sample and how the answers are collected. Our published methodology describes the approach; the practical reasons for it are below.
Cover different buying questions
Findrix builds a prompt set around the market and the product. The set stays fixed while your plan and prompts remain unchanged. You can review, edit and add questions in Your Prompts. This creates a defined space of buying questions in which to compare your brand with selected competitors.
The mix determines what the score means. Different question types test different situations:
- Discovery and problem questions test whether the brand appears when the buyer has not named it.
- Non-branded comparison and evaluation questions test which products appear against a requirement or when the buyer asks to compare types of solutions. Questions that name a tracked brand belong to the separate branded set.
- Branded questions test what the engine says when the buyer already knows the name. Findrix excludes them from Share of Voice: naming a brand in the question would give it a different starting position from brands the engine introduces on its own. Keep this reputation and positioning check separate from discovery measurement.
The Discovery Gap, a preprint testing 112 Product Hunt startups with GPT-4o-mini and Perplexity Sonar, found much higher recognition in named questions than appearance in discovery questions. This supports checking the two situations separately; its rates are specific to that study's sample and models.
Coverage requires review. Check the proposed set against your actual product capabilities, sales conversations, support requests and customer research. Look for missing buying situations, irrelevant questions and repeated variants that give one topic too much influence. Review the balance across question types as well as individual wording.
This is a practical check of coverage, not statistical proof that the sample represents every buyer conversation. We do not treat generated prompts as observed AI search demand. Avoiding estimated frequency weights leaves the composition of the question set as an explicit methodological choice. Adding many non-branded prompts about one use case gives that use case more influence on SoV.
Measure variation and keep engines separate
Findrix asks questions repeatedly and reports metrics by engine, with confidence ranges for key visibility measures. Repeats help assess variation within a question; distinct questions provide breadth. Neither substitutes for the other.
The preprint Don't Measure Once: Measuring Visibility in AI Search documents variation across runs, prompts and time. It supports repeated sampling rather than relying on a single answer. In Findrix, the practical benefit is a way to judge whether a movement is consistent enough to act on, while the confidence range describes uncertainty within the measured sample.
Engine-level results also make investigation more specific. If the gap is concentrated in one engine, start with that engine's answers and sources. An overall average could hide the problem or make a local gain look universal.
Check the setup before establishing a baseline
Alongside the prompt review, confirm the competitors, brand-name variants, engines, language and market. These define the comparison you will repeat. An omitted competitor or an unrecognized product name can distort the result even when the prompts are relevant.
Collect at least five dated observations per prompt as a starting baseline. This is a minimum for this workflow, not a guarantee of precision: review the variation and the breadth of questions before interpreting a small change.
Before using the result, check that you can trace the score to the counted brands, evaluated answers and collection period. Keep the underlying answers available so a colleague can understand the calculation and review your conclusion.
Your AI Share of Voice changed. What actually changed?
When two results cannot be compared
Several changes to the measurement setup can move a percentage without a corresponding change in how AI answers the original questions:
- A plan upgrade. Moving from Growth to Authority expands the measured set. If the non-branded prompts included in SoV change, establish a new baseline for that set.
- Editing prompts without increasing their number. Replacing one buying question with another changes what is being tested, even if the prompt count stays the same.
- Adding custom non-branded prompts. Adding many questions about one use case gives it more influence on the overall score. Branded prompts are excluded from Findrix SoV, so adding those alone does not change its calculation.
- Changing the competitive set. Adding or removing a tracked competitor changes whose mentions enter the denominator, even if the AI answers remain the same.
- Changing engines, markets or language. These changes alter the conditions of the comparison. Keep results under different setups distinct.
The key takeaway: know what is inside the metric before interpreting its movement. For Findrix SoV, the denominator is the mentions of your brand and selected competitors in evaluated answers to non-branded prompts. Mention Rate and Citation Rate use their evaluated answer pools. When the included questions or comparison conditions change, record the change and establish a new baseline.
How to interpret a change in AI Share of Voice
Once the measurement setup is comparable, a change in SoV becomes a question about your brand, its competitors and the answers behind the movement.
Suppose your mention-based SoV rises from 18% to 24%. Your mentions may have increased, competitors' mentions may have fallen, or both may have happened. First check that the measurement setup is comparable, then inspect the underlying counts. Start by asking three questions:
- What changed? Look below the overall score. Was the movement concentrated in one AI engine, topic or group of prompts?
- Who moved? Because SoV is relative, your score can change when a competitor gains or loses mentions, even if your own count stays flat.
- Which gap deserves work? Focus on questions relevant to customers' buying decisions. Read the answers and cited pages, then check the corresponding product information before choosing a content update or another intervention.
There is no universal target percentage. Equal shares among four brands would be 25% each, but that is arithmetic, not a performance benchmark. Judge the result against your competitive set, your baseline and the buying questions that matter to your business.
What to do with the results
Start with a relevant buying question where competitors appear more often. Read the answers, check what those competitors are being credited for, and inspect the cited sources. Compare that evidence with your own page. The useful finding is specific: a capability left unexplained, an inaccurate claim, or a comparison the page does not answer.
Findrix connects visibility analysis with proposed changes and prepares text or markup for review, including where to apply it. Your team chooses and implements the change.
How Kinescope chose what to fix
The published Kinescope case shows this workflow for a B2B video platform. Weekly prompt reviews exposed buyer questions that existing pages did not answer clearly, although the product had the relevant capabilities.
The team checked product language and technical gaps, then clarified existing pages, expanded FAQs and strengthened internal links. The audit also found structured data presenting the product as costing zero on 35 pages. Those findings gave the team specific work it could apply to existing content.
Kinescope shipped changes and checked the following weekly runs. The table shows two published Mention Rate endpoints over four weeks; these are not SoV results.
| AI engine | Start Mention Rate | End Mention Rate |
|---|---|---|
| Google AI Overviews | ≈2.4% | ≈8.6% |
| ChatGPT | ≈10.5% | ≈14.0% |
The case reports different paths across engines: Gemini and Perplexity peaked earlier, while ChatGPT fell before recovering. Read these as directional observations: the comparable sample changed slightly on some surfaces, and the study had no control group. The results do not isolate the effect of any one fix.
Where to find the evidence in Findrix
- Open AI Visibility to see the engine cards and Share of Voice against competitors. Compare the relevant runs and keep each engine's result visible.
- Use Competitors to review the tracked brands, their SoV histories and the brand-by-engine mention matrix. Confirm that the comparison includes the alternatives your buyers consider.
- Return to the question list in AI Visibility and open the engine answers for a relevant prompt. Use Facts & positioning to inspect how the response matches your product facts.
- Open Where AI gets its answers to inspect cited domains and their coverage across questions and engines. Use its search and filters to narrow the source list, then read the relevant pages. A cited domain is evidence to inspect; check separately whether it is a realistic placement opportunity.
- Use Your Prompts to review the measured questions and their mix. Establish a new baseline when a change affects the sample included in the metric you are comparing. Adding branded prompts alone does not change Findrix SoV because they are excluded.
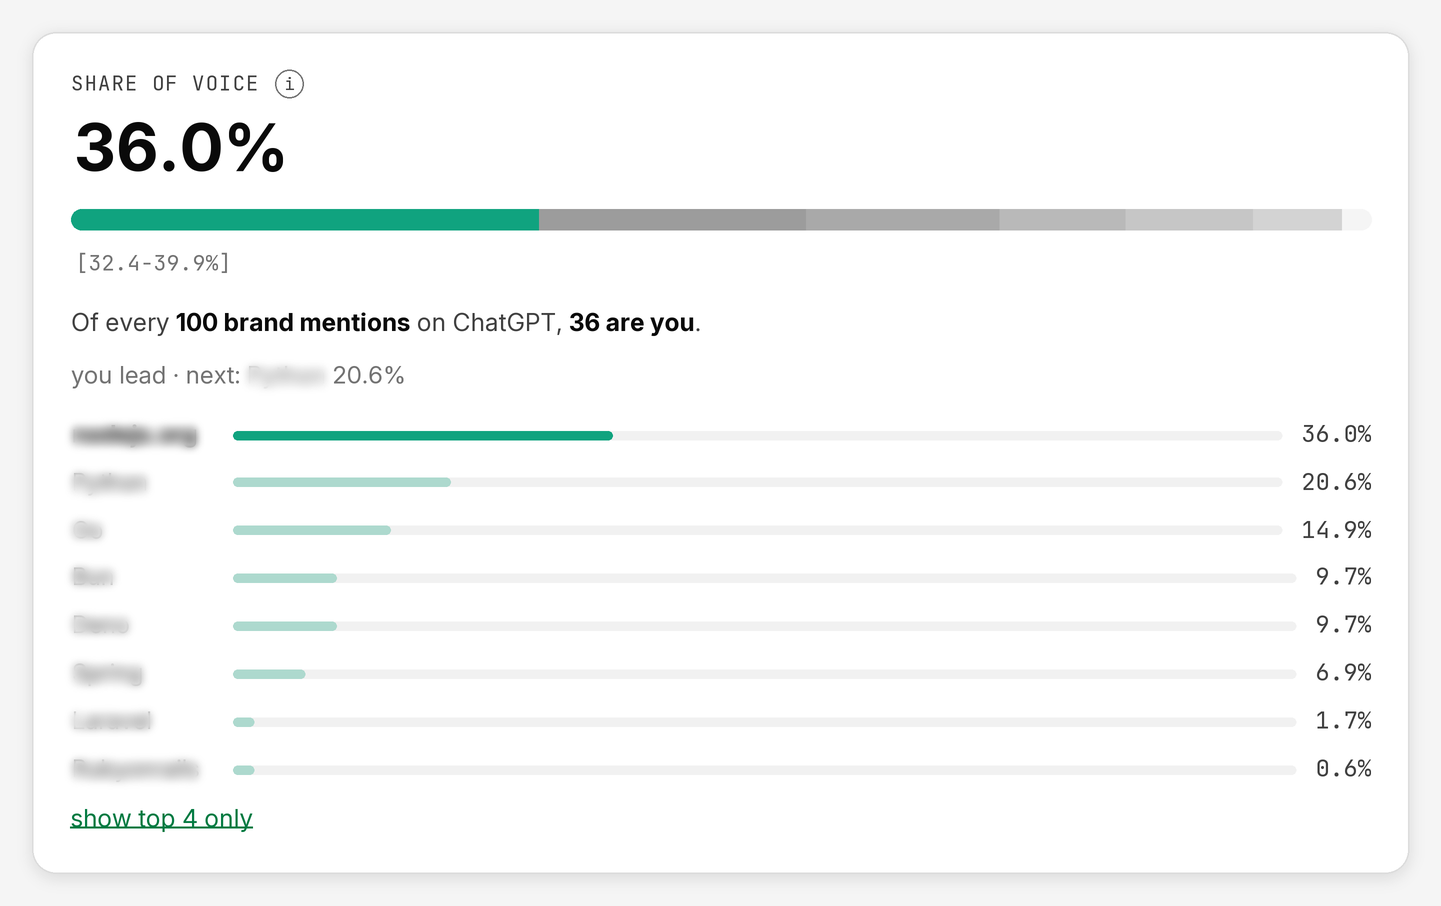
How to explain AI Share of Voice to a client
For an agency, the job is not only to track the metric. It is to explain what moved, connect the movement to evidence and avoid claiming more than the data proves.
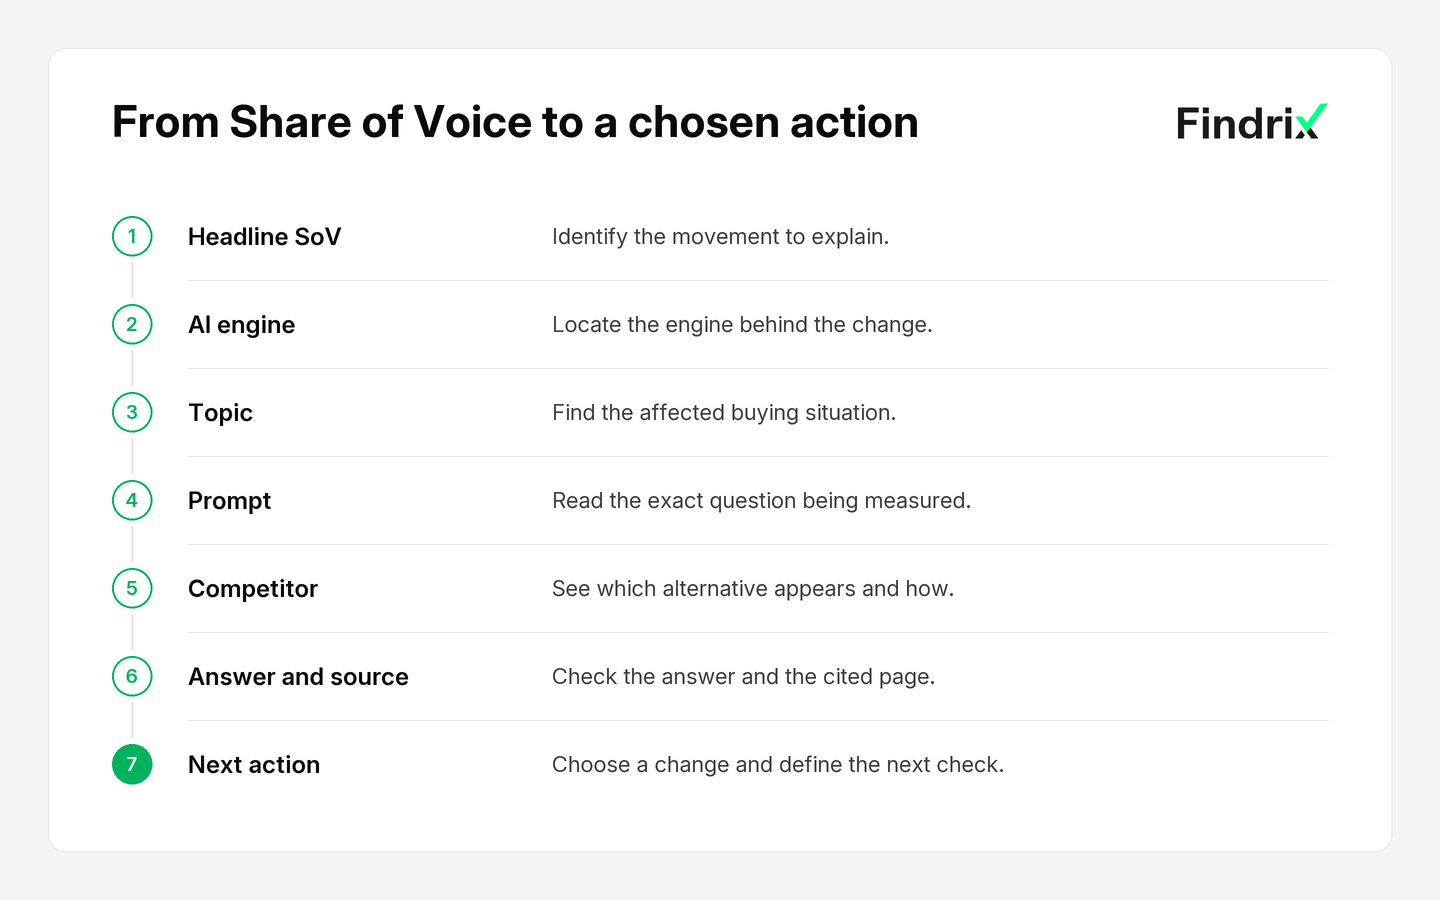
Follow the score down to the evidence before assigning an action.
If SoV increased, identify where the gain came from. If it decreased, determine whether the client lost visibility, a competitor gained it or the measurement setup changed.
Connect the work to the relevant questions and observable changes in answers. A useful evidence trail looks like this:
Work completed → movement in relevant prompts → observable changes in answers or citations → interpretation with appropriate uncertainty.
Keep the headline metric alongside its scope and evidence. Fill in this reporting template for each engine:
- AI Share of Voice: [previous] → [current], with confidence ranges
- Measurement scope: [engine, market, periods, measured prompts and competitive set]
- Strongest topic: [topic]
- Main competitive change: [competitor and movement]
- Relevant work completed: [work]
- Interpretation: [what the evidence suggests]
- Next action: [action]
Include the measurement scope and any baseline change in the report so the reader can interpret the comparison.
Frequently asked questions
What is AI Share of Voice?
AI Share of Voice measures a brand’s share of a defined signal, such as mentions, relative to selected competitors in a sample of AI-generated answers. It describes that measurement set, not the entire market.
How do you calculate AI Share of Voice?
For mention-based SoV, divide your brand’s mentions by the total mentions of your brand and selected competitors, then multiply by 100. Findrix uses this definition per engine. Other tools may weight the calculation by estimated impressions, so check the methodology.
What is a good AI Share of Voice?
There is no universal benchmark. Evaluate the score relative to a stable competitive set, your baseline, strategically important topics and movement over time.
What is the difference between AI visibility and AI Share of Voice?
Mention Rate measures the proportion of evaluated answers that name your brand. Mention-based Share of Voice measures your share of mentions relative to your brand plus selected competitors. Your mention rate can rise while your SoV falls.
Can AI Share of Voice be compared across tools?
Only after confirming that the tools use compatible prompts, competitors, engines, markets, sampling and formulas. Identical percentages can represent different underlying measurements.
How often should AI Share of Voice be measured?
Measure consistently enough to distinguish trends from answer variation. The appropriate schedule depends on the number of prompts, engines, repeat observations and reporting needs.
Can AI Share of Voice prove GEO or SEO ROI?
Not by itself. SoV measures competitive presence in sampled AI answers. Evaluate revenue separately through referral traffic, conversions and customer-reported discovery. A visibility increase after a content change does not, by itself, establish causation.
Run a free Findrix audit and see which AI engines cite you.
Run free auditRead next
What is GEO? Generative Engine Optimization Explained (And How It Differs From SEO + AEO)
GEO is how brands get cited inside ChatGPT, Perplexity, and Gemini answers. Definitive guide to Generative Engine Optimization, GEO vs SEO vs AEO, and how to start.
3 AI Search Visibility Metrics & KPIs You Need to Track
3 AI search visibility metrics and KPIs that drive revenue: share of voice, citation ownership, and AI-attributed conversions.