

 Deutsch
 Français
 Español
 Português (Brasil)
 Italiano
Best GEO Tools 2026
 Danila Kadtsyn7 min readNovember 15, 2026
Key takeaways
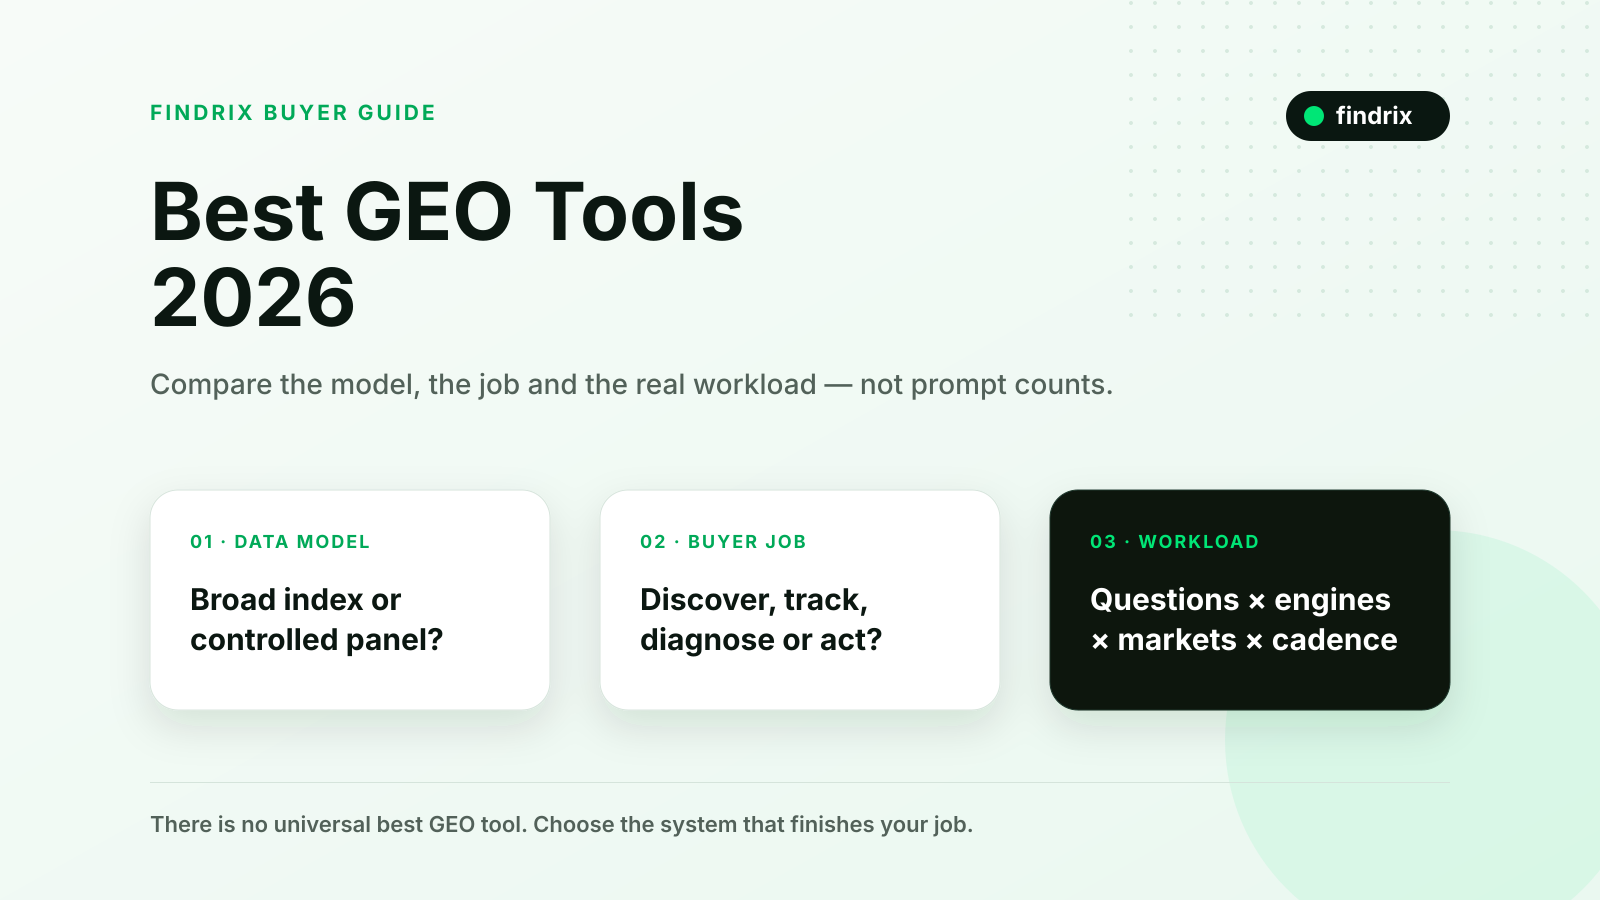
- Broad indexes and controlled prompt panels answer different questions.
- Prompt limits are meaningless without engines, markets and cadence.
- Test finalists on the work they leave behind after detection.
Two GEO tools can measure the same brand on the same day and return different visibility numbers without either product being broken. One may search a broad, pre-collected database of AI answers. Another may run a controlled set of buyer questions chosen by the customer. Those systems are observing different markets.
That makes most “best GEO tools” rankings unstable. They compare prompt limits, engines and dashboard features before asking what the buyer is trying to learn.
The first decision is the data model. Do you need to discover where the market already talks about your brand, or measure how a fixed set of important buyer questions changes over time? The second decision is the job the product must complete: monitoring, diagnosis, corrective work or governance. Only then should you compare price.
This guide uses one framework throughout:
Data model → Job completion → Workload economics
It produces a conditional shortlist rather than a universal winner.
Why most best GEO tools lists compare unlike products
The current market contains at least two distinct measurement models.
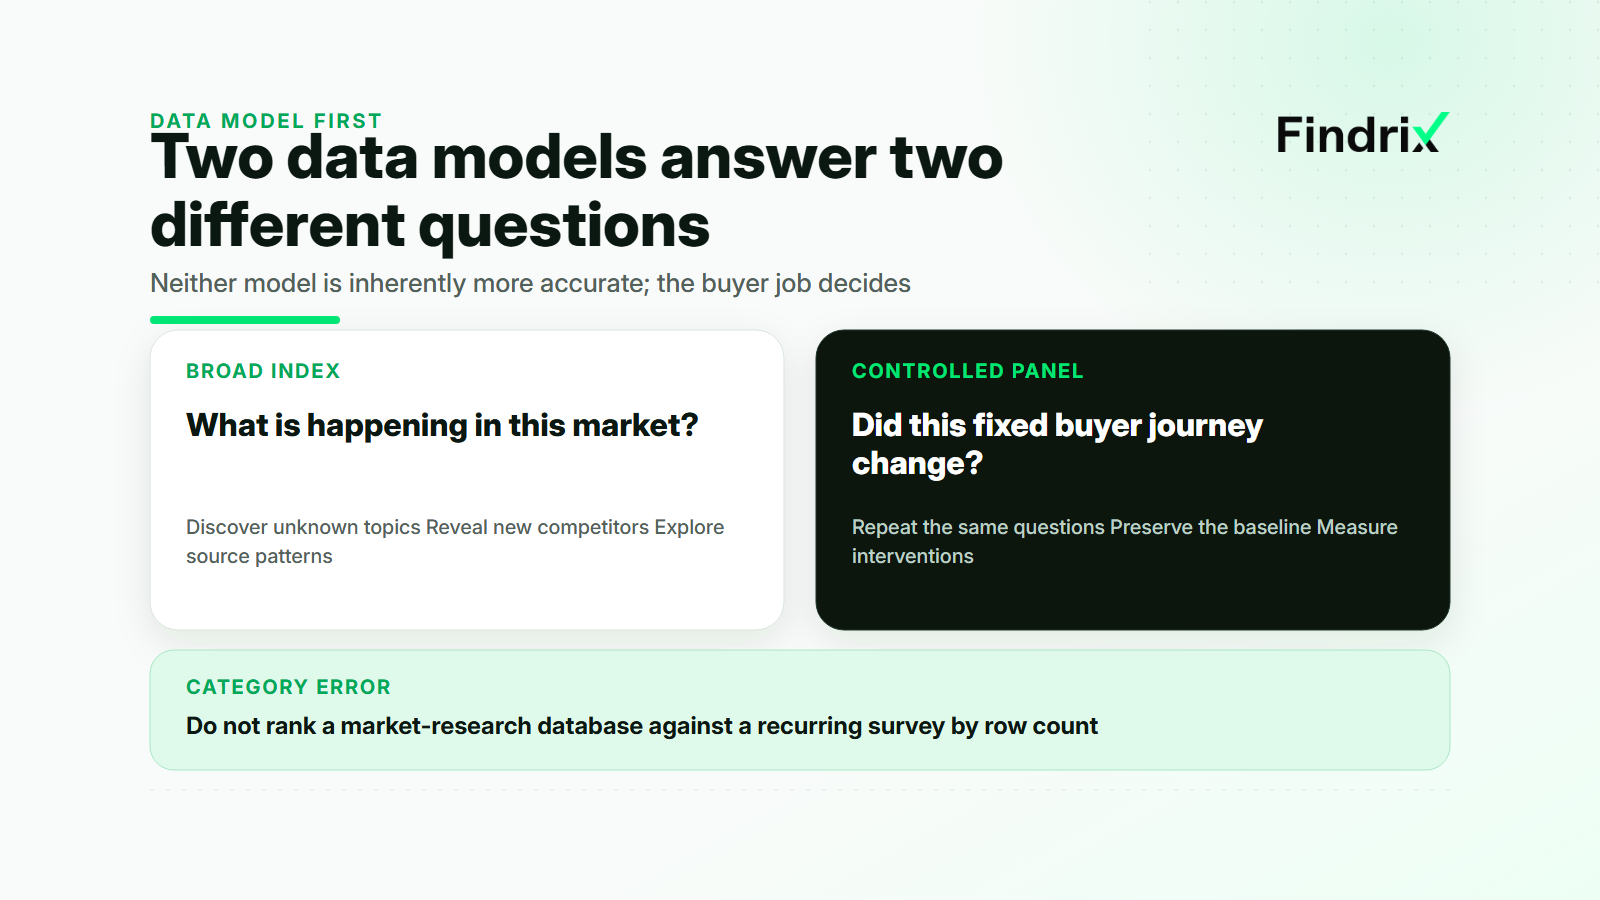
A broad index collects a large body of AI answers and lets the user search across it. This is useful when the team does not yet know which questions, competitors or themes matter. It can reveal unexpected demand, source patterns and brand associations. Ahrefs Brand Radar is a clear example of this discovery model.
A controlled prompt panel repeatedly asks a defined set of questions across selected engines, markets or schedules. This is useful when the team already knows the decisions it wants to monitor: whether a brand appears in a shortlist, whether a product fact is correct, or whether visibility changed after a documented intervention. Peec, Otterly, Rankscale and similar AI search monitoring tools fit variations of this model.
Neither model is inherently more accurate. They answer different questions. A broad index can discover a conversation the team never thought to track. A controlled panel can preserve a baseline for a specific buyer journey. Comparing them by the number of prompts or answers is like ranking a market-research database against a recurring survey by row count.
Choose the data model and job before the vendor
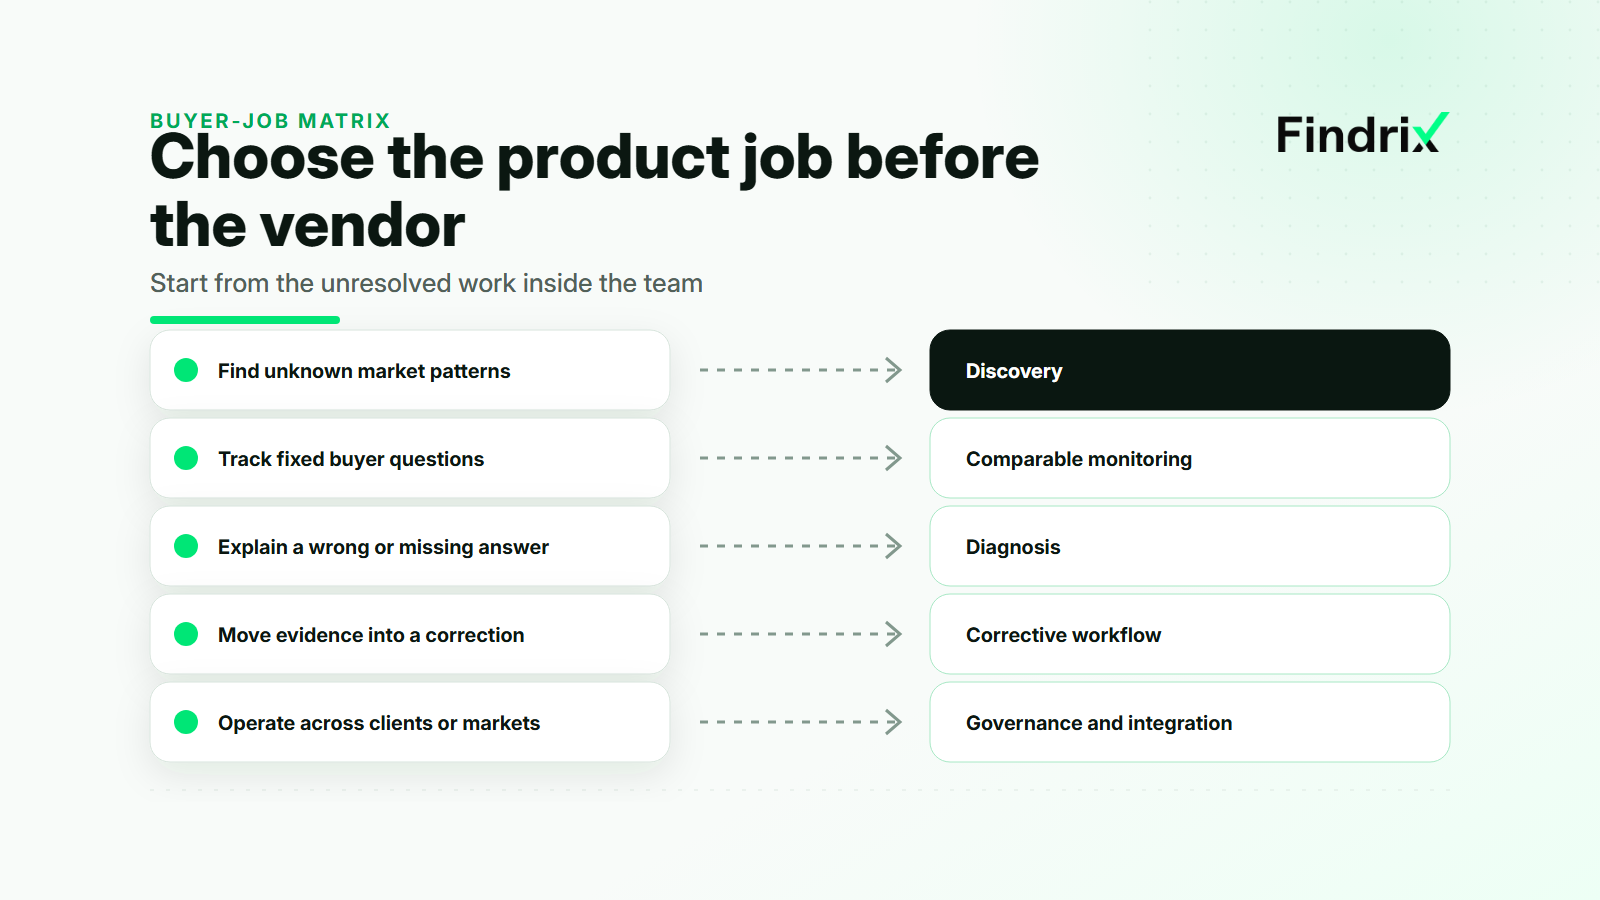
Start with the unresolved question inside the team.
| What the team needs | Best starting model | Product job that matters |
|---|---|---|
| Find unknown topics, competitors or citations | Broad index | Discovery and market research |
| Track fixed buyer questions over time | Controlled panel | Comparable monitoring |
| Understand why an answer is wrong or missing | Either, with source depth | Diagnosis |
| Turn evidence into an approved correction | Controlled workflow | Corrective output and remeasurement |
| Operate across teams, clients or markets | Either, with controls | Governance and integration |
Practical example 1: One normalized mid-market workload
Suppose a mid-market company sells three products in two markets. It wants to monitor awareness questions, comparison questions and validation questions such as integrations and security. It also wants to know which source reinforces a wrong answer and move the evidence into its internal workflow.
A broad index is valuable during discovery. It may show questions and competitors the team omitted. But the recurring reporting baseline should use a controlled panel because the company needs the same buyer journey each month. Monitoring alone is not the full job. The product must preserve funnel context, explain source evidence and support the next action.
This distinction also prevents overbuying. A team that only needs monthly monitoring does not automatically need an enterprise intelligence platform. An agency managing many clients may need permissions, exports and repeatable delivery even if its analytical question is simple.
Normalize cost with one monitoring workload
Prompt count is not a comparable pricing unit. One prompt can be checked across several engines, in several markets and at different cadences. Some plans count checks or credits. Others limit projects, workspaces, exports or indexed access.
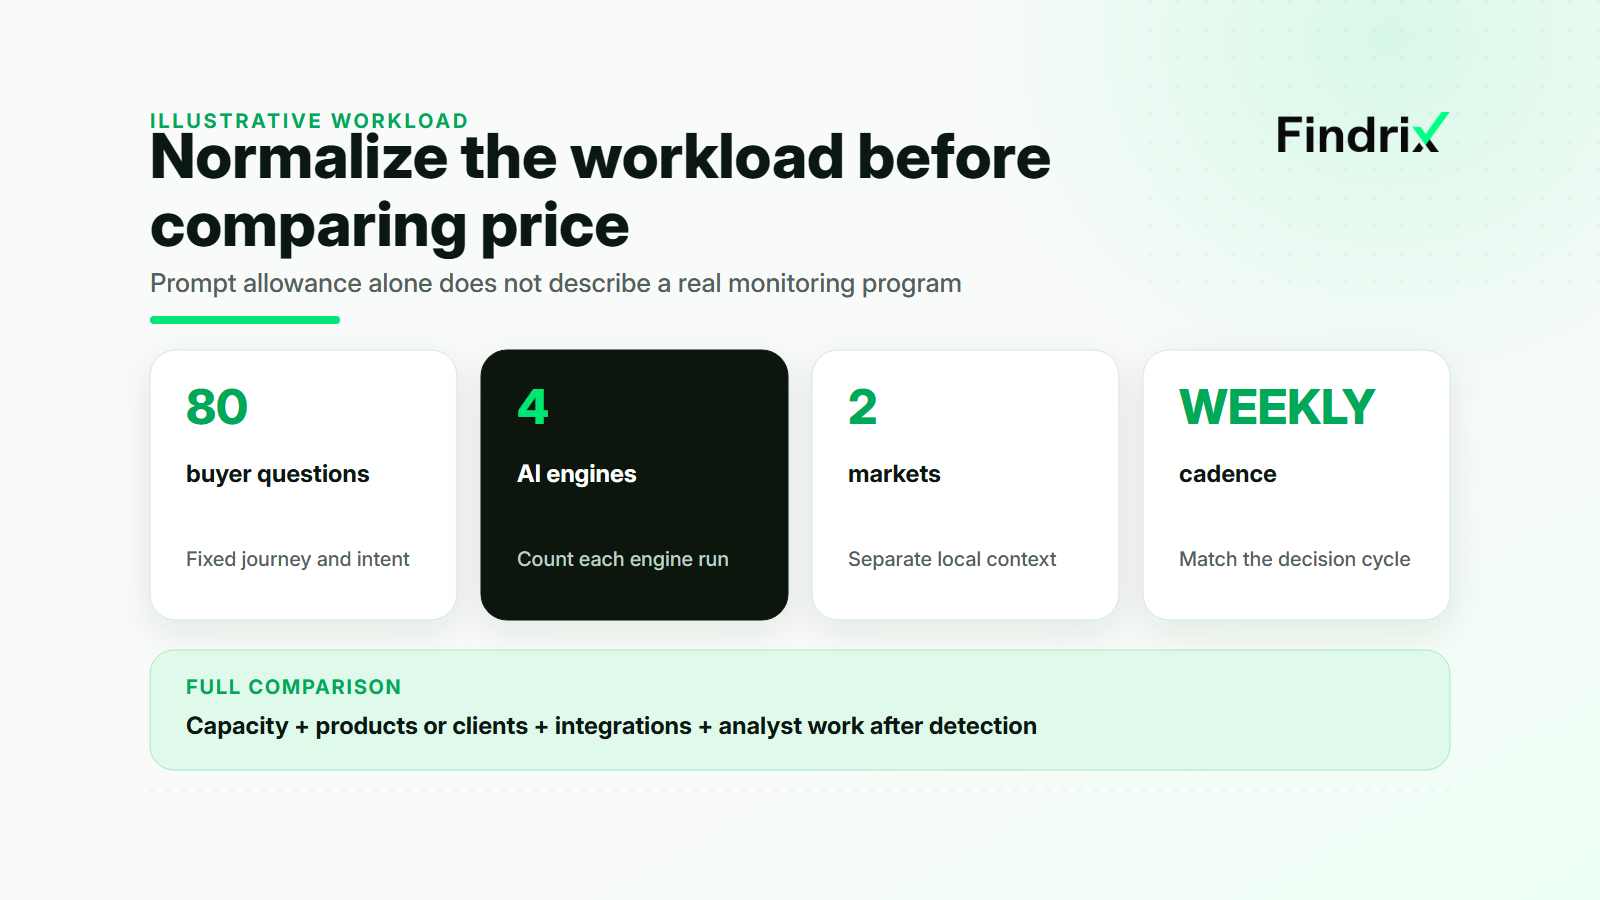
Use one workload for every finalist. For example:
- 80 buyer questions
- 4 engines
- 2 markets
- Weekly measurement
- Separate product or client views
- A monthly evidence export and action review
The 80 prompts are only the visible starting point. The effective workload depends on how each tool counts engine runs, locations and refreshes. Otterly’s current model, for example, uses credits connected to prompt checks, engine selection and cadence, with some engines consuming differently. Its nominal prompt allowance cannot be compared directly with a product that prices a project or a fixed panel.
Refresh frequency should follow the business decision. Daily monitoring can be justified during a launch, a reputation issue or a high-risk correction. It adds little when the team reviews content changes once a month and cannot act on daily movement. More frequent charts are not automatically better evidence.
For each finalist, calculate:
- The capacity required for the normalized questions, engines, markets and cadence
- The number of products, clients or workspaces included
- The export, API or MCP access needed for the workflow
- The analyst time required after an issue is detected
- The cost of any reporting, source-analysis or implementation layer outside the product
This is a generative engine optimization tools comparison, not a starter-plan comparison. The lower subscription can create the higher operating cost when the team must assemble the rest of the workflow itself.
Best GEO tools in 2026 by buyer job
The following shortlist maps products to the job they appear strongest at based on official product and pricing material checked on 10 November 2026. Packaging changes quickly, so limits and prices should be verified before purchase.
Ahrefs Brand Radar for broad market discovery
Ahrefs Brand Radar uses a large pre-collected answer database rather than only a customer-defined prompt set. It is a strong starting point when the team wants to explore where a brand, competitor or topic appears across AI answers without first designing the entire panel.
The boundary is methodological: broad discovery does not replace a stable prompt set for controlled before-and-after measurement. It is best when the open question is “What is happening in this market?”
Peec AI for controlled tracking and agency reporting
Peec centers on custom prompt tracking and packages reporting workflows for agencies. It fits teams that know which questions matter and want repeatable project-based monitoring with reporting integrations.
The buyer should verify the plan limits against the normalized workload and account for any external reporting work. Its value depends on whether the delivery model matches the team or agency.
Otterly AI for monitoring-first teams
Otterly supports multi-engine monitoring, workspaces, GEO audits and recommendations. It is a credible choice when the primary job is tracking defined questions and the team accepts a credit model tied to engines and cadence.
The trial should reveal how quickly the real workload consumes credits and what work remains after a problem is surfaced. Agencies should also account for its current lack of native white-labeling if client delivery matters.
Semrush for teams already operating in its suite
Semrush packages AI visibility inside a broader SEO and marketing ecosystem. That can reduce tool switching for existing customers, but buyers should still test the AI workflow itself rather than infer depth from the surrounding suite.
Profound for enterprise intelligence and governance
Profound is positioned for enterprise intelligence and governance. It fits buyers whose organizational controls matter as much as monitoring, but that scope can be unnecessary for a lean team.
Rankscale for accessible monitoring and branded reporting
Rankscale combines AI visibility monitoring with branded dashboard links. It can fit teams and agencies that want a straightforward tracker with a shareable client surface, provided they verify what is branded and how usage scales.
Findrix for a full-cycle agency or mid-market workflow
Findrix is designed for teams that need the operating chain around monitoring: scalable tracking, funnel and customer-journey segmentation, source and data analysis, MCP connectivity and ready-to-apply corrective work.
That makes it a strong full-cycle option when the problem is not only “Where are we visible?” but “Which buyer-stage answer is wrong, what evidence supports the diagnosis, how does this move into our workflow, and what should the team apply before the next measurement?”
Findrix does not automatically deploy changes. It prepares the correction and evidence for human review and application. The advantage is the amount of specialist work removed between the gap and a defensible next action, not a promise that software edits the live site by itself.
Test finalists on the work they leave behind
Choose two finalists and give them the same test. Load the same questions, engines and markets. Preserve the same funnel structure. Then introduce one real decision task: an important product integration is described incorrectly in AI answers.
Ask each product to support the full path:
- Find the affected questions and buyer stage
- Show the answer and available source evidence
- Separate a recurring issue from response variation
- Produce the next corrective action or the evidence needed to prepare it
- Move the result into the team’s reporting or working system
- Rerun the same questions after the team applies the change
Record what the tool completes and what an analyst must do elsewhere. That remaining work is often more important than another dashboard feature.
The best GEO tools in 2026 are therefore best for different jobs. Use a broad index for discovery. Use a controlled panel for a stable baseline. Choose monitoring-first software when the team already owns diagnosis and execution. Choose a fuller operating system when source work, integration and corrective action are the bottleneck. Then compare every option on the same workload rather than the most attractive number on its pricing page.
Read next

10 Best AI Overviews & AI Mode Trackers in 2026: Tested & Compared
This article from Findrix compares the 10 best AI Overviews and AI Mode trackers in 2026, from Search Console and rank trackers to brand trackers, and shows which kind answers which question. Findrix is an action-based AI visibility and GEO platform that turns ongoing tracking and analysis of a brand's presence across AI answers and search into fast optimization, built for brand managers, marketing leaders, and agencies running AI search for their clients.

11 Best AI Visibility Tools in 2026 (Tested & Compared)
This article from Findrix compares the 11 best AI visibility tools of 2026: engines covered, methodology transparency, AI preference scoring, fact checking, trials, and entry pricing, with honest picks by job. Findrix is an action-based AI visibility and GEO platform.
Best White-Label AI Visibility Tools for Agencies
Compare white-label AI visibility tools by client surface, delivery labor, capacity and total portfolio cost before choosing an agency platform.
11 Best Answer Engine Optimization Tools (AEO) in 2026: Tested & Compared
We tested the 11 best AEO tools of 2026, from Findrix and Profound to AirOps and Semrush, on what each one tracks, fixes and costs.